
Introduction
A/B Tests let you try a feature or setting change on a controlled slice of your traffic, measure the revenue, delivery, and engagement impact, and then decide, based on your own data, whether to roll the change out to 100% of your visitors.
Use it any time you want to validate a change before committing site-wide. That might be turning on a feature you've been curious about (outstream video, vignettes, sticky side rails, anchor ads, and more), trying a different anchor position, or comparing identity options like Google One Tap and Social Login. Instead of flipping a switch and hoping, you can run a true split test. A slice of your traffic keeps the current setup, another slice gets the variation, and the dashboard surfaces the results so you can decide.
A/B Tests evaluate variations across multiple dimensions: revenue and yield (EPMV, RPM, ad revenue), delivery (impressions per pageview, viewability, CTR), and engagement (bounce rate, engagement rate, pageviews per visit). You can decide based on whichever metrics matter most for your site.
Instructions
There are three things to know: how to start a test, how to monitor it while it's running, and how to act on the results.
Two Ways to Start a Test
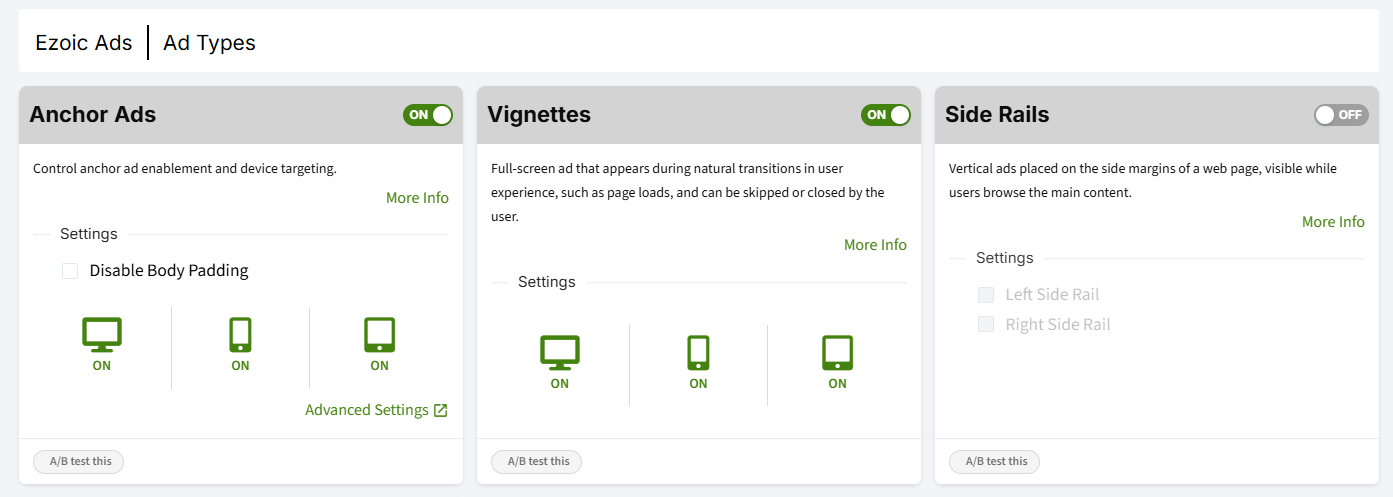
1. Inline from the Ad Types page (most common path). Navigate to EzoicAds > Ad Types. Each ad type card (Anchor Ads, Vignettes, Side Rails, Sticky Sidebar, Ezoic Video, In-Content Ads) has an A/B test this button at the bottom. Clicking it opens the configuration modal pre-filled with the relevant settings for that ad type. This is the fastest path when you already know which feature you want to test.
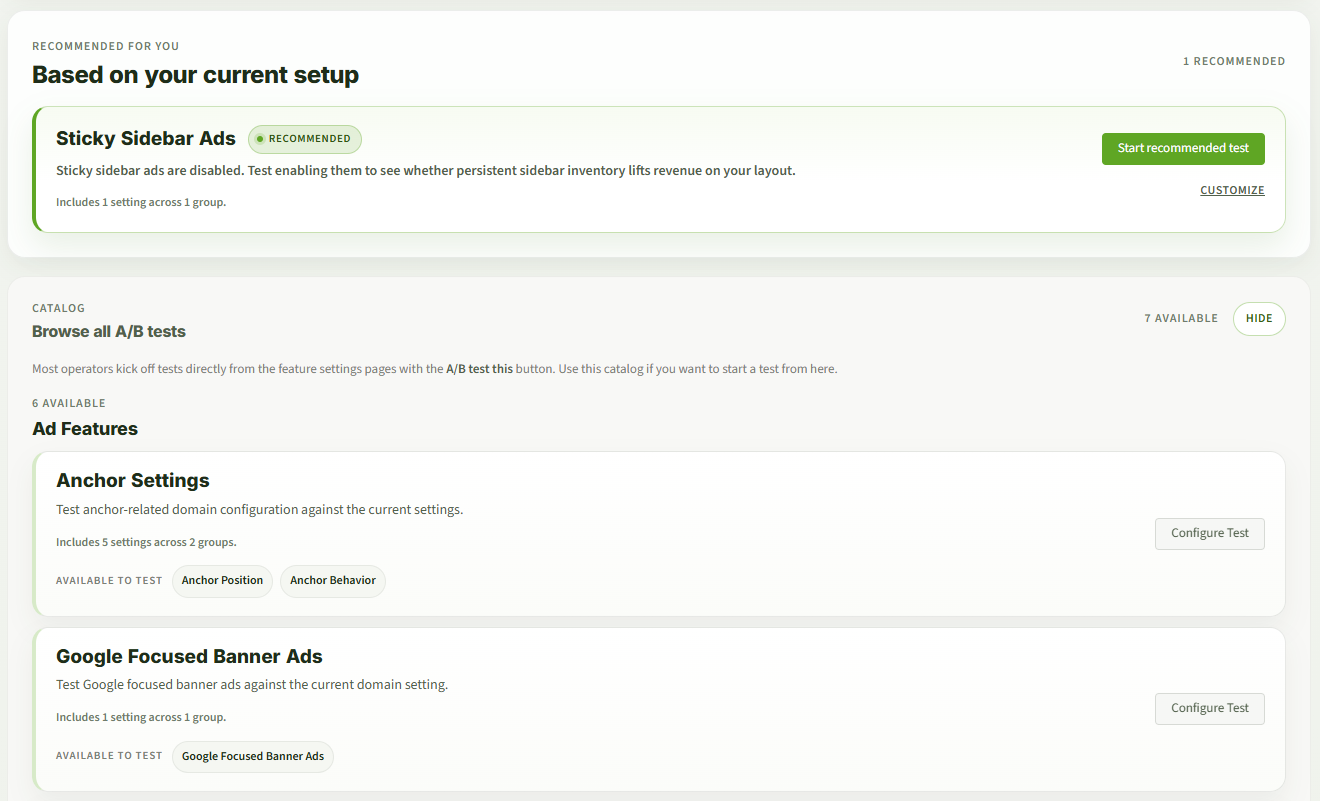
2. From the A/B Tests catalog. Navigate to EzoicAds > A/B Tests. The catalog lists testable features grouped by category and includes recommended tests based on your current setup. Use the catalog when you want to browse what's available or pick up a system-recommended test.
Tests currently available include:
- Ad Features: Anchor Settings (position and behavior), Google Focused Banner Ads, Vignettes (Desktop / Mobile / Tablet), Ezoic Video (Universal Player and outstream), In-Content Ads (sticky vs. static), Side Rails (Left / Right).
- Identity: identity-related tests including Google One Tap, with additional Social Login provider tests becoming available over time.
Configuring a Test
Clicking A/B test this or selecting a test from the catalog opens a configuration modal. You'll typically see:
- A list of settings you can test. Each setting shows its current value alongside the options available to test against. For example, an Anchor Ads test might show:
- Desktop Anchor Position: Now
Bottom→ TestToporBoth - Mobile Anchor Position: Now
Bottom→ TestToporBoth - Anchor Expansion: Now
Full→ TestDisabled - Desktop Double Anchor: Now
Enabled→ TestDisabled
- Desktop Anchor Position: Now
- Anything you leave blank keeps its current value. You only need to pick the settings you want to vary. The rest of your configuration stays the same on both sides of the test.
- A traffic allocation slider with three segments:
- Control: the share of traffic that gets your current settings.
- Test variant: the share that gets the picked changes.
- Not in test: the share of traffic that's excluded from the experiment entirely and continues on your current configuration.
- Default split. Test traffic is divided 50/50 between Control and Test variant so the two are directly comparable. You can adjust the size of the test (and therefore the unaffected portion of your traffic) to be more or less conservative. Smaller test allocations mean more of your traffic stays on the current setup, but the test will take longer to reach a confident result.
- A summary line confirming how many settings will change in the test variant before you launch.
Click Start Test when you're ready.
Monitoring a Running Test
The Running Tests section on the A/B Tests page shows every active test with at-a-glance status:
- Variation is ahead / Variation is behind / Inconclusive: the headline status indicator.
- Metric deltas between control and variation (EPMV, RPM, etc.).
- Visits per arm: how much data each side of the test has collected.
- What's being tested: a summary of the settings under evaluation.
- Allocation split: the percentage of traffic in control, variation, and not in test.
You can pause a running test, manage its configuration, or open the full Results view at any time.
Reading Results
The Results view shows:
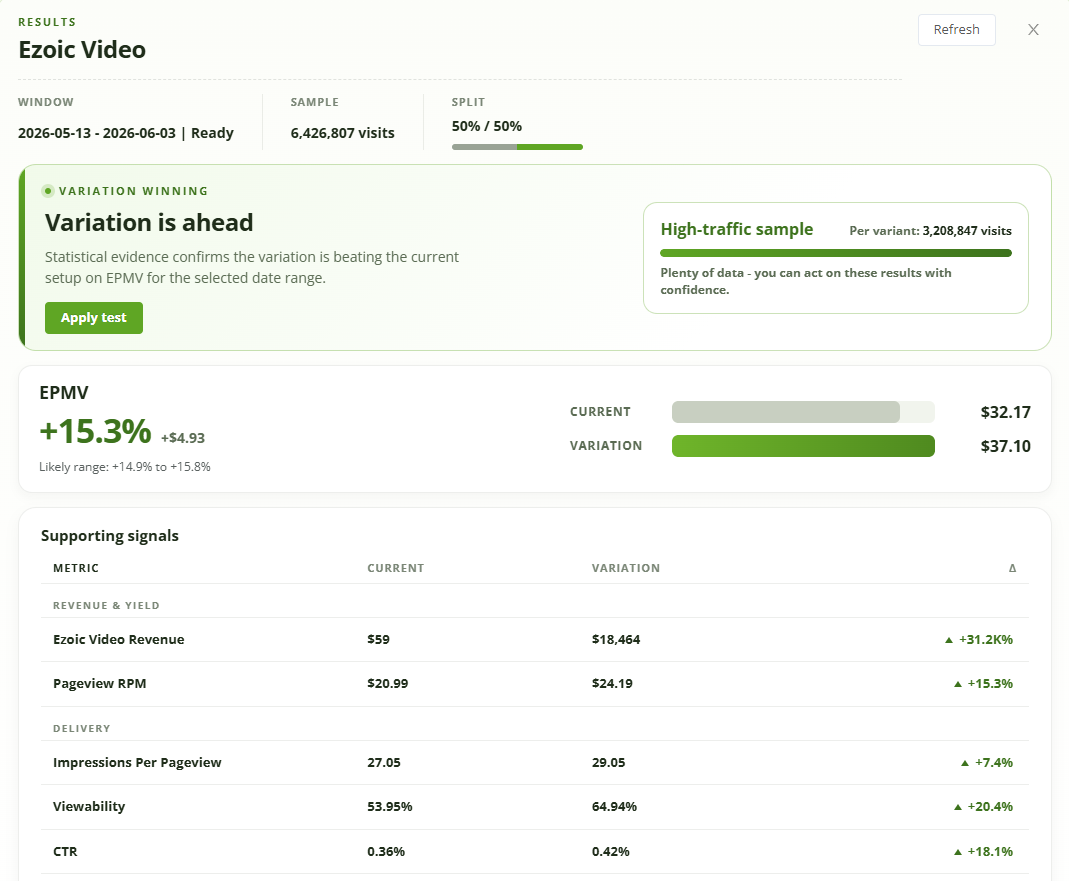
- The headline. A clear "Variation is ahead," "Variation is behind," or "Inconclusive" status, along with whether there's enough statistical evidence to act.
- Sample confidence. A "High-traffic sample" badge appears when there's enough data per variant to act with confidence. Lower-traffic tests will continue collecting data until confidence is reached.
- The headline metric delta with a likely range (e.g., "+X% with a likely range of +Y% to +Z%"). The range tells you how tightly the test has narrowed in on the true impact.
- Supporting signals, grouped into:
- Revenue & Yield: EPMV, Pageview RPM, ad revenue by type.
- Delivery: Impressions Per Pageview, Viewability, CTR.
- Engagement: Bounce Rate, Engagement Rate, Pageviews Per Visit.
Looking at the full set of signals is important because a variation can win on revenue while affecting other dimensions of your site experience. If engagement drops meaningfully, you can decide whether the revenue change is worth that trade-off, or stop the test and try a different variation.
Applying a Test
Once the dashboard shows there's enough data to act on the result:
- Open the Results view.
- Click Apply test.
- The winning variation becomes your new live setting for 100% of traffic, and the test moves to Completed Tests for reference.
If you'd rather not apply the change (for instance, if the variation wins on one metric but loses on another you care more about), you can stop the test without applying.
FAQs
How long does an A/B test need to run?
Until the dashboard tells you there's enough data to make a confident decision. There's no minimum time requirement. It's purely a function of statistical confidence. A higher-traffic test reaches a confident result faster than a lower-traffic test. Smaller test allocations (a smaller slice of traffic in Control + Test variant) will take longer because each variant needs enough visits for the result to be statistically meaningful.
Can I run multiple A/B tests at the same time?
You can have multiple tests running simultaneously, but overlapping tests on related settings can muddy the data for each individual test. As a rule of thumb, test independent features in parallel and test related features sequentially.
What if I want to stop a test before it's finished?
You can pause or stop a test from the Running Tests view at any time. Stopping a test before it has gathered enough data simply ends it without applying the variation. Your current setup stays live.
What happens to the data after I apply a test?
Applied tests move to Completed Tests history, where you can review the results at any time. The winning variation becomes your active configuration for 100% of traffic from that point forward.
Can I undo an applied test?
Yes. You can change the setting back manually on the feature's settings page, or start a new A/B test in the reverse direction (current vs. previous configuration) if you want to validate before reverting.
What's the difference between A/B Tests and Revenue Opportunities?
Revenue Opportunities are recommendations our system surfaces based on patterns across the platform. Many of them include a test internally to validate the uplift before applying. A/B Tests give you direct access to the testing framework, so you can run your own validation on any of the testable features regardless of whether they're currently surfaced as an Opportunity.
Why does my test show a very large percentage change in one of the supporting signals?
If you're testing a feature that's currently off (such as enabling outstream video on a site where it's currently disabled), the Control side may have a near-zero baseline for that signal, which causes the percentage change to look extreme. The percentage in that case isn't a meaningful uplift number. It's the result of comparing against a near-zero baseline. Focus on the absolute values and the metrics you care about most when interpreting these results.
Contact Information for Further Assistance
If you need further assistance with A/B Tests, please log in via support.ezoic.com to make use of our dedicated resources for support. We're here to help!
